to select the |
The task COMB is a general purpose program for combining two images, pixel by pixel, to obtain a third image. Many options are available and, as a first example, we illustrate inputs to subtract a continuum image from a spectral line image cube.
A common method to obtain a spectral data cube containing only line signal without any continuum emission is to create a line-free continuum image C, and subtract it from the data cube L. For a more general discussion and alternative methods see §8.3. COMB can be used to this purpose as follows:
> OUTN ’xxxxx’ C R | to specify xxxxx for the name of the continuum-free image cube. |
> OUTC ’ccc’ C R | to specify ccc for the class of the continuum-free image cube, e.g., LCUBE. |
> OPCODE ’SUM’ C R | to select the addition algorithm. |
> APARM 1, -1 C R | to specify that we want +1 × L - 1 × C. |
> GO C R | to compute the continuum-free, line-only output cube. |
Once COMB task has terminated with the message COMB: APPEARS TO END SUCCESSFULLY, you should find the requested image in your catalog:
> MCAT C R | to list the images in your catalog. |
As a second example, we derive the polarization intensity and angle from the Q and U Stokes parameter images. To compute a polarized intensity image, enter:
> OUTN ’xxxxx’ C R | to specify xxxxx for the name of the polarized intensity image. |
> OUTC ’ccc’ C R | to specify ccc for the class of the polarized intensity image, e.g., PCLN. |
> BPARM ns1 , ns2 C R | to specify the noise levels of the 2 images. |
> GO C R | to compute the corrected, polarized intensity image. |


 will write the message TASK COMB BEGINS followed by a listing of the POL. INTENSITY algorithm. While it
is running, you can prepare the inputs to make a polarization position angle image. Type:
will write the message TASK COMB BEGINS followed by a listing of the POL. INTENSITY algorithm. While it
is running, you can prepare the inputs to make a polarization position angle image. Type:
> OUTN ’yyyyy’ C R | to specify yyyyy for the name of the polarization angle image. |
> OUTC ’ddd’ C R | to specify ddd for the class of the polarization angle image, e.g., PSIMAP, CHICLN. |
Once COMB has finished, enter:
> GO C R | to compute the polarization angle image. |
Task POLCO performs a similar operation to ’POLC’ on polarization amplitude images with a different algorithm. In 31DEC26, task POLTS may be used to investigate the bias in polarization amplitude due to the fact that is always positive even though the Q and U images have Gaussian noise. POLCO offers a second correction algorithm computed using POLTS.
COMB may also be used to re-scale images, and to compute spectral indices, optical depths, etc. Type:
The OPCODE options are:
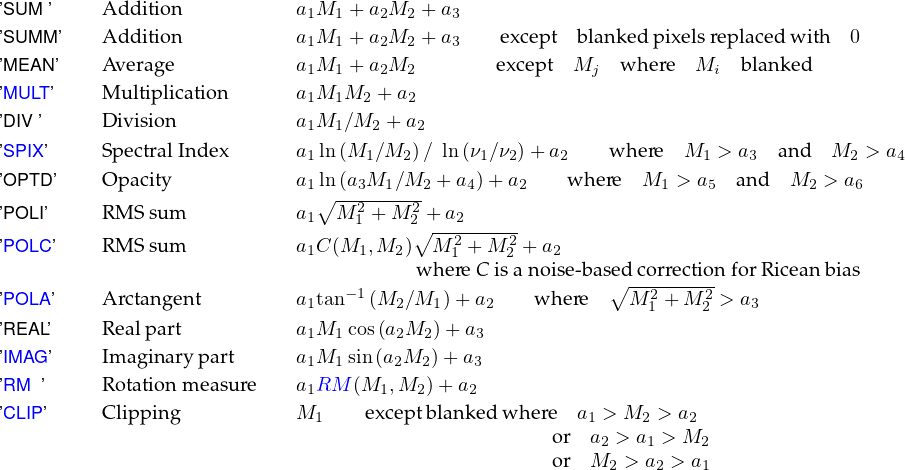
where the ai are user-adjustable parameters — specified by APARM — and M1 and M2 are the images selected by INNAME, etc. and by IN2NAME, etc., respectively. COMB may be instructed to write an image of the estimated noise in the combination in addition to the direct result of the combination. These noise images may be used as inputs to COMB and, e.g.,BLANK to control later computations. When combining numerous images together, set DOHIST=-2 to prevent history files from becoming much larger than the images.
CONVL can compute the cross-correlation of two images and report the location of the peak cross-correlation.
COMB can use images of the uncertainties in the first two input images to control the computation of the output. The new task RMSD may be used to create an image of the rms in an image, computing the rms self-consistently (robust, histogram, and median absolute deviation methods available) in windows surrounding each pixel. Task FLATN can compute weight and noise images corresponding to mosaiced images.
For some applications of COMB, undefined pixel values may occur. For example, if the spectral index is being calculated and the intensity level on either image is negative, the index is undefined. In this case, the pixel value is given a number which is interpreted as undefined or “blanked.” Blanking also arises naturally in operations of division, opacity, polarization angle, and clipping and, of course, the input images may themselves be blanked. In addition, the output image can be blanked (set BPARM(4) = 0) whenever either M1 <APARM(9) or M2 <APARM(10). Alternatively, blanking may be done on the basis of the estimated noise (set BPARM(4) = 1) or signal-to-noise ratio (set BPARM(4) = 2) in the combination. See HELP COMB C R for a description of these options and certain limitations in their use. With APARM(8) = 1 C R, the user may specify that all undefined pixels are to be assigned an apparently valid value of zero, rather than the “magic” undefined-pixel value. Alternatively, the task REMAG can be used to replace blanked pixels in the output image with a user-specified value.
When combining two or more images, COMB, PCNTR, et al. must decide which pixels in the 2nd image go with which pixels in the 1st image. The user input parameter DOALIGN controls this process. A value of 1 requires the two headers to be correct and sufficiently similar that an alignment by coordinate value is possible. A value of -2 tells the programs to ignore the headers and align by pixel number. Enter HELP DOALIGN C R for details and intermediate options. In some cases, the images may have been created on different grids which are correctly described in the headers. The observations, for example, could have differed in the phase reference position or projective geometry used or the imaging could have been done with different axis increments. Such images should not be combined directly. Instead, the header of one should be used as a template for re-gridding the other. tasks HGEOM and OHGEO provide this service with good interpolation methods. See §7.6.1 and type EXPLAIN HGEOM C R or EXPLAIN OHGEO C R for more information.
 algorithm with correction for noise.
  algorithm.