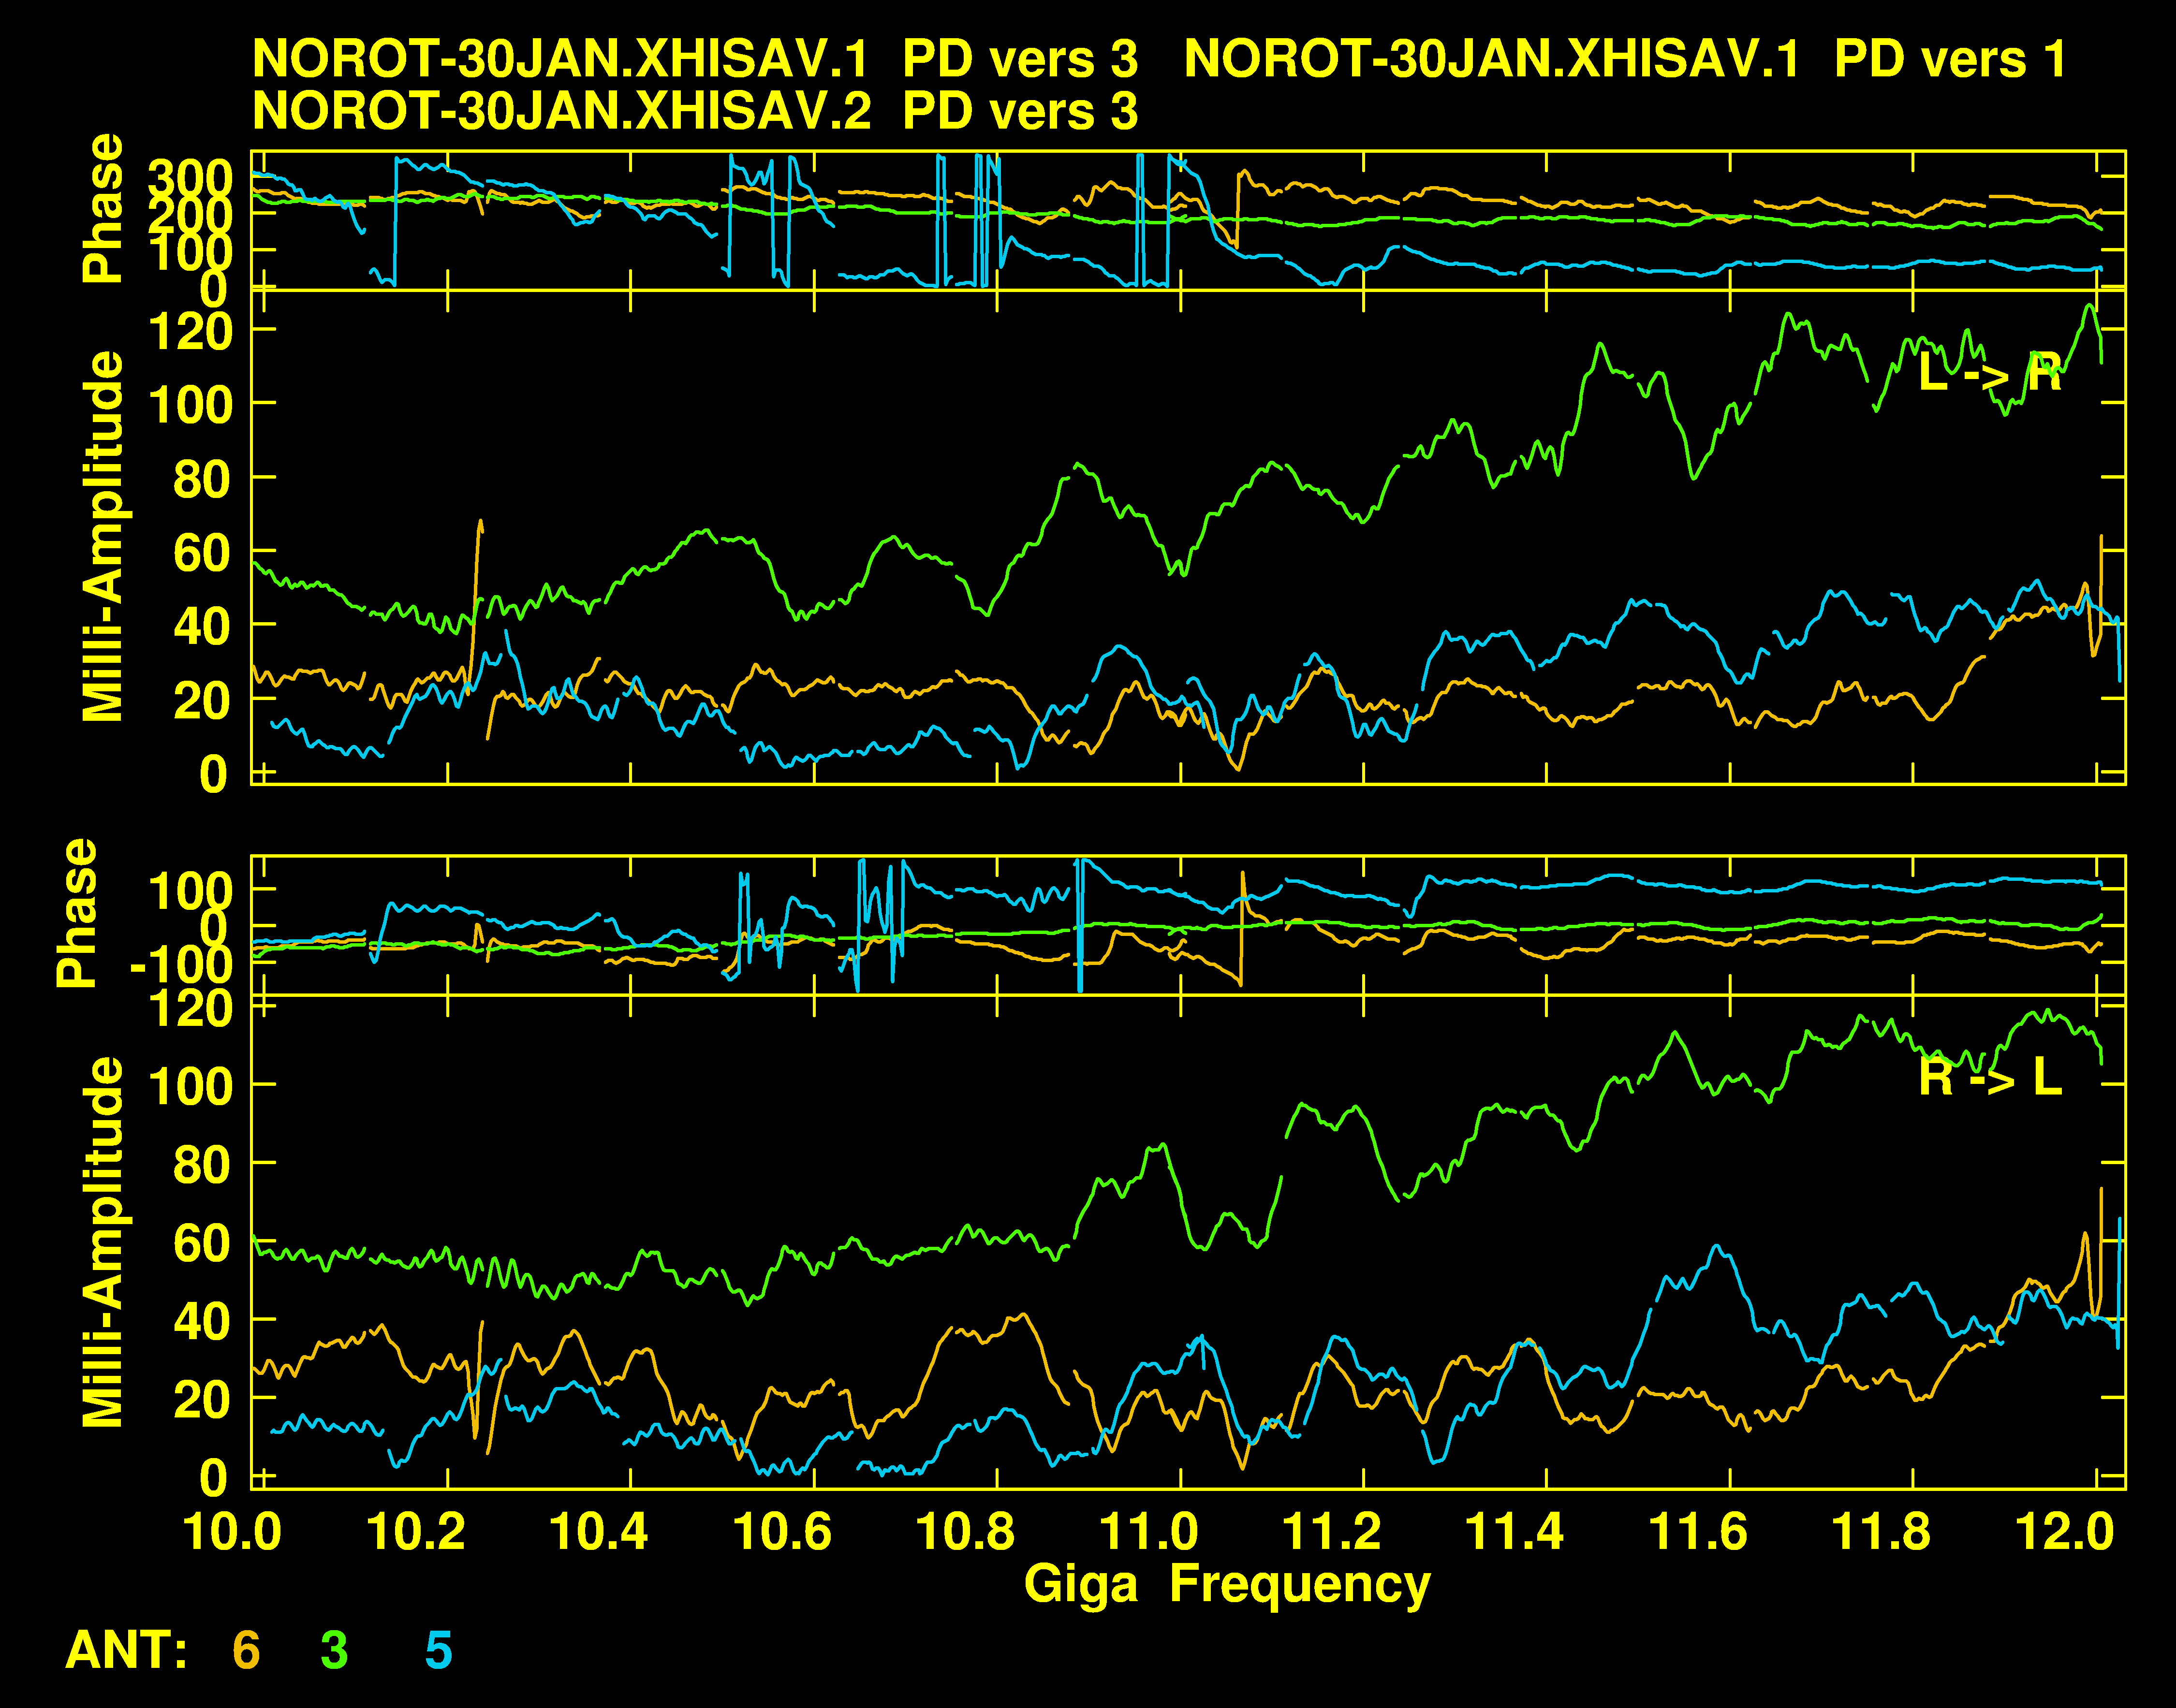
Figure V.6: The second plot from the example PDPLT.
The basic calibration task PCAL will write channel-dependent polarization D-terms into a PD table (§4.3.16). POSSM can plot PD tables, one antenna at a time while BPLOT can plot all antennas on one plot, separated vertically. In 31DEC20 a new task PDLT was written to plot up to four PD tables on top of each other. This allows comparison of an antenna’s D-term spectrum over time, i.e., in multiple data sets with different antenna stations. Antennas may also be compared as in the example below.
To run DLT on one file to compare different antennas,
> INVERS 3 C R | to set the PD version to use with the first data set. |
> IN2VERS 1 C R | to set the PD version to use with the second data set. |
> IN3VERS 3 C R | to set the PD version to use with the third data set. |
> ANTENNAS 1, 6 C R | to select the antennas from the first PD table to appear in the two plots. |
> BPARM 2, 3 C R | to select the antennas from the second PD table to appear in the two plots. |
> CPARM 4, 5 C R | to select the antennas from the third PD table to appear in the two plots. |
> ECHAN 62 C R | to omit 2 questionable channels in each IF. |
> OPTYPE ’A&P’ C R | to lot both amplitude and phase. |
> APARM 0 0 1 C R | to label the x-axis with frequency. |
> FACTOR -0.05 C R | to use connected line plots only. |
> DO3COLOR 1 C R | to separate the plots with color. |
> INP C R | to check your adverb values. |
> GO C R | to run the task. |
The second of the two plots made is shown in Figure V.6.